Category: Evaluation & Observability
Abstract
Hallucinations in retrieval-augmented generation (RAG) systems are often reported as a single quality defect, yet production incidents rarely have a single cause. In practice, most incorrect answers originate from one of three distinct breakpoints: the system misses the required evidence, the retrieved evidence drops out before the final context window, or the generator produces claims that are unsupported by the selected evidence. Treating these as one phenomenon obscures causality and slows remediation.
A production diagnosis stack works better when it reconstructs the evidence path from user query to generated claim, then instruments that path with low-cost measurements that map naturally to pipeline ownership. Four practical metrics—Query Coverage (QC), Evidence Overlap (EO), Answer Coverage (AC), and Citation Coverage (CC)—separate retrieval misses, selection losses, and grounding drift. Paired with stable traces, those metrics give on-call teams a clearer path from symptom to subsystem.
The operational goal is reliability: lower mean time to diagnosis, clearer subsystem ownership, and fewer repeat incidents through stage-aware monitoring and release controls.
1. Reframing hallucination as evidence-path failure
Many teams still ask a broad question when troubleshooting RAG outputs: “Did the model hallucinate?” That framing is too coarse for production engineering because it conflates fundamentally different failure causes. A more useful question is: where did the evidence path fail first? Once this reframing is adopted, debugging becomes causal rather than anecdotal.
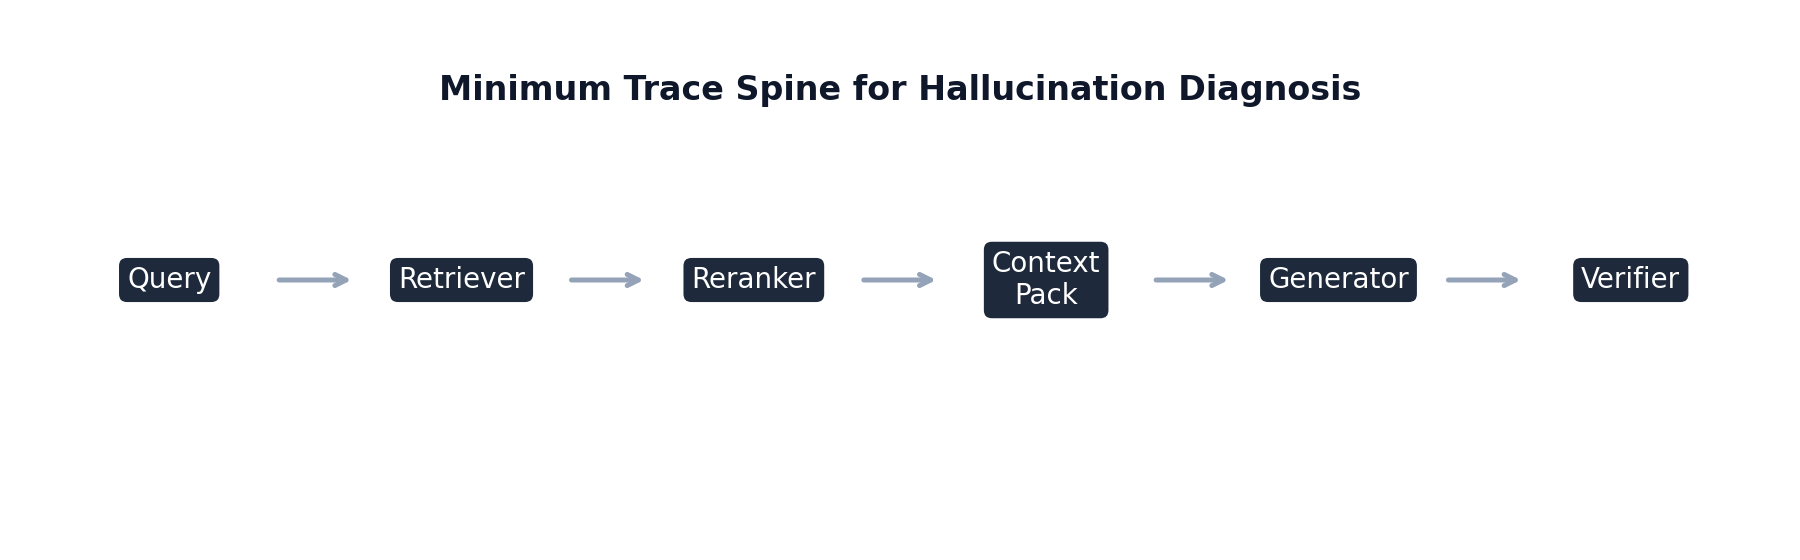
A typical RAG pipeline transforms information through a sequence of stages: query processing, candidate retrieval, reranking, context assembly, and generation. Errors can appear at each stage independently, and the same final symptom—an incorrect answer—can emerge from very different upstream causes. If the retrieval stage misses the governing policy document, no amount of prompt adjustment in generation can produce a reliably grounded answer. Conversely, if the relevant policy clause is already in context and the output still contradicts it, retrieval is not the root cause and should not be the primary remediation target.
This distinction has concrete organizational consequences. Retrieval and indexing teams own corpus freshness, chunk quality, and recall behavior. Ranking and context-selection teams own prioritization under token limits. Prompt and model-governance teams own grounding discipline under generation constraints. A single blended hallucination rate offers little help when assigning responsibility or defining corrective action. Stage-aware telemetry, by contrast, enables a direct mapping from observed signature to owner.
The practical implication is straightforward: before modifying model prompts, temperature, or decoding settings, first verify whether required evidence was retrievable and whether it was actually selected. Teams that institutionalize this order of operations avoid a common anti-pattern in RAG operations: repeatedly applying generation-layer fixes to retrieval-layer failures, which may transiently reduce visible incidents while leaving structural defects untouched.
2. Trace schema for causal diagnosis in production
Effective diagnosis requires traceability across the full request lifecycle. Token-level introspection can be useful in research settings, but it is not required for production value. A compact event schema, if consistently captured, is sufficient to support reliable root-cause analysis.
At minimum, each request should carry immutable identifiers and version metadata, including request_id, tenant_id, session_id, timestamps, query class, model identifier, prompt hash, retriever version, reranker version, and index build/version tag. Version data is not clerical overhead: without it, regressions cannot be correlated to specific rollouts, and rollback decisions become speculative.
The retrieval event should log a sufficiently deep candidate list (typically top-50, even if only top-8 or top-12 are passed forward), with per-candidate chunk_id, doc_id, source metadata, retrieval modality, and retrieval scores. Logging only the selected context creates diagnostic blindness because many failures occur in the transition between “retrieved” and “selected.” If the key chunk appears at rank 18 and is lost later, a context-only log will falsely suggest retrieval failure.
Reranking and context-selection events should preserve rank transitions and token-budget decisions. In particular, rank deltas are often among the strongest immediate indicators of misalignment: if exception clauses or footnotes repeatedly drop during rerank, the system may be over-optimizing for generic semantic centrality instead of answer-critical evidence. Context assembly logs should include ordered chunk lists, truncation signals, and token allocation per chunk to reveal packing pathologies that silently remove high-value text.
Finally, generated outputs should be segmented into factual claim spans (sentence-level granularity is often sufficient), and each span should be linked to candidate supporting chunks with support and contradiction indicators. Even coarse span-level attribution enables a substantial shift from output-only judgment to evidence-grounded diagnosis.
Schema stability matters as much as schema richness. Deterministic chunk identities and stable field definitions enable longitudinal comparisons across deployments. If chunk identifiers drift across re-indexes, trend analysis loses fidelity and apparent metric changes can reflect instrumentation artifacts rather than model behavior.
3. Coverage metrics and attribution signals
Once trace data is available, the next step is to compute metrics that isolate the first broken stage. The objective is not to maximize metric count but to use a small, interpretable set that aligns with operational decisions.
Query Coverage evaluates whether required query facets are represented in retrieved candidates. Let denote required facets (e.g., entity, time interval, jurisdiction, version constraint), each with weight . For top- candidates , define
Low is a direct signal that retrieval or rewrite has likely failed to preserve intent-critical constraints. High , however, is only a necessary condition; it confirms candidate availability, not final grounding.
Evidence Overlap measures agreement between selected evidence and expected/oracle evidence on curated evaluation sets. A common formulation is Jaccard overlap between selected set and reference set :
When remains high while drops, retrieval likely succeeded but selection policy degraded. This signature is particularly informative during reranker or context-packer updates.
Answer Coverage estimates the fraction of factual spans supported by selected evidence. Let spans be weighted by importance , and let (or a calibrated probability) be derived from entailment checks:
Low with stable and strongly suggests generation drift: the model had relevant evidence but did not remain faithful to it.
Citation Coverage quantifies whether factual spans carry explicit evidence links:
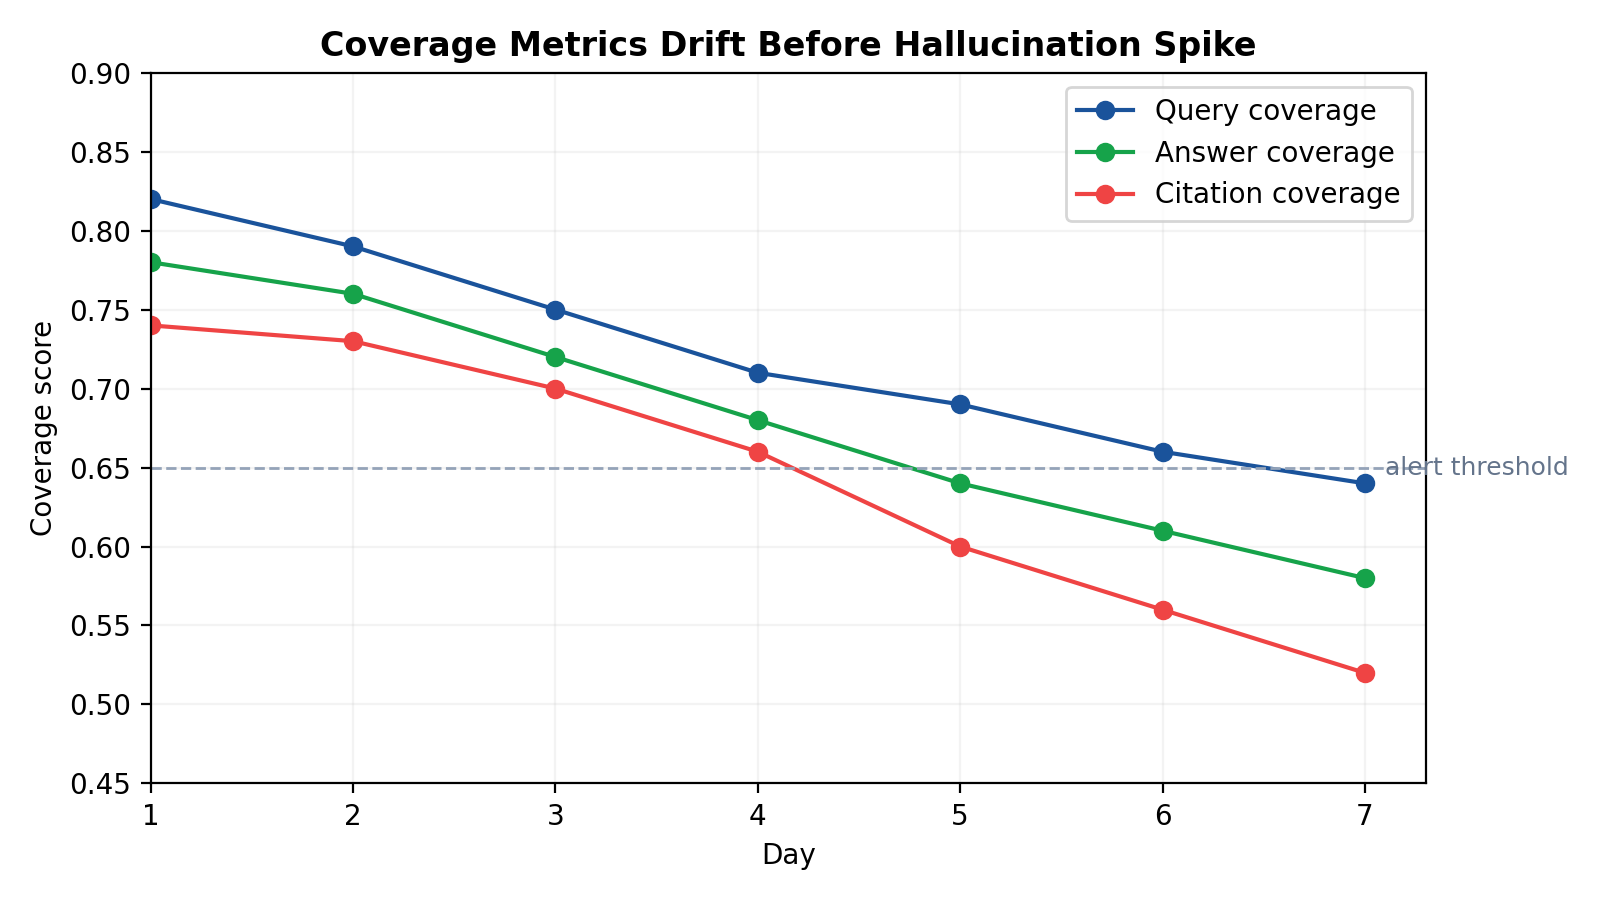
is not truth itself, but it is an important control variable for grounding behavior. In many enterprise deployments, abrupt citation decline is an early-warning precursor to later contradiction growth.
Metric interpretation is most reliable when paired with lightweight attribution methods. A practical stack uses semantic span-to-chunk matching for always-on telemetry, compact entailment or NLI verification for precision, and selective chunk-drop ablation in high-severity postmortems to test causal dependence. This layered approach balances cost and diagnostic fidelity.
4. Incident patterns and remediation logic
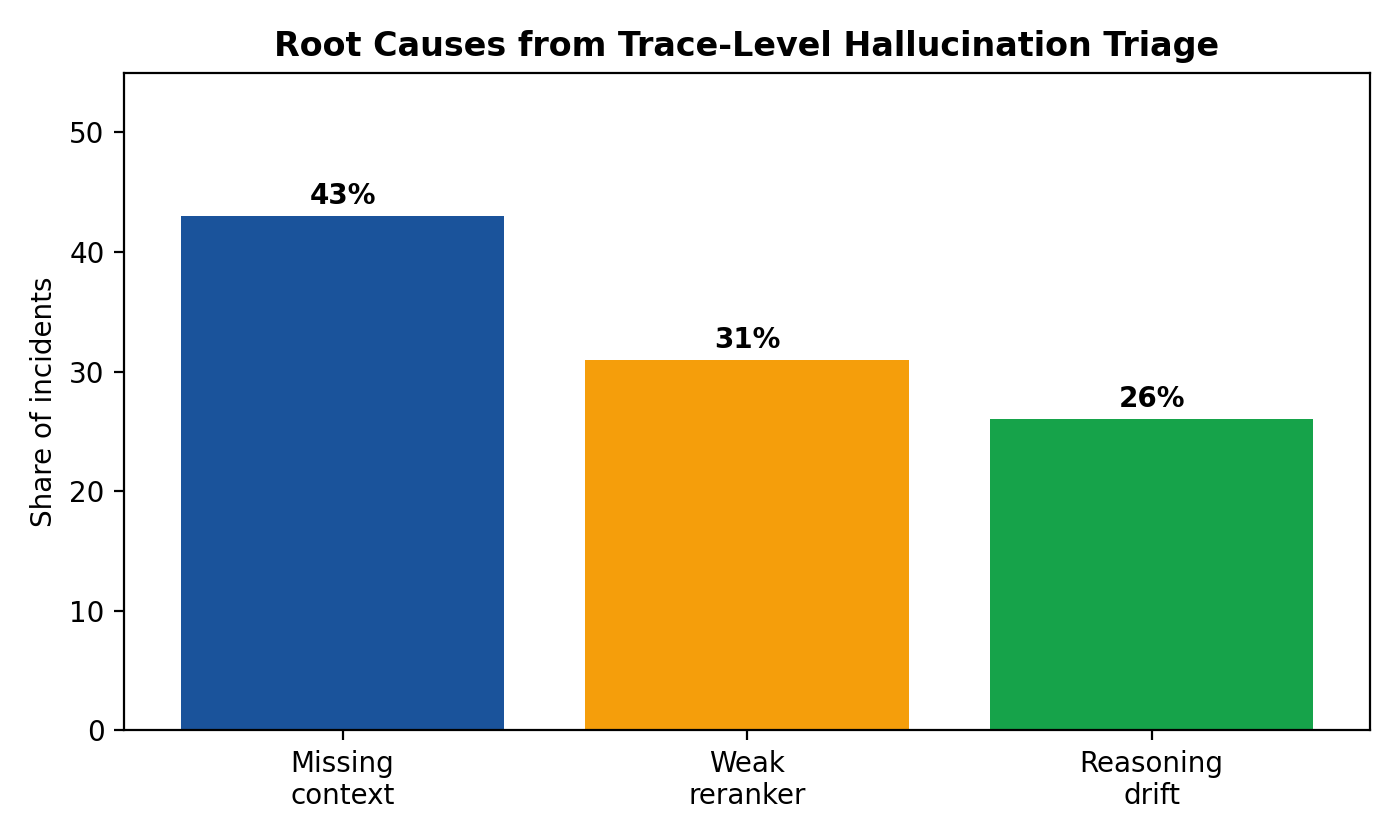
When coverage and attribution metrics are observed together, recurrent hallucination incidents become classifiable rather than idiosyncratic. Three patterns appear consistently across production systems.
The first pattern is a retrieval miss: is low, is low, and is low. In this case, required evidence never enters the viable candidate pool. Common causes include ingestion lag, stale indexes, query rewrites that drop temporal or jurisdictional constraints, and chunking strategies that fragment or bury critical clauses. Corrective actions should prioritize source freshness SLAs, rewrite constraint retention tests, domain-specific chunking revisions, and retrieval objective recalibration.
The second pattern is selection loss: is high but is low, with often moderately degraded. Here the retrieval layer surfaced useful evidence, but reranking or context packing removed it. Typical causes include rerank objectives that overweight generic semantic similarity, insufficient diversity in selected context, and token budgeting rules that favor broad summaries over exception-heavy passages. Effective mitigation usually involves reranker hard-negative training around edge clauses, section-aware packing, and token reservation policies for exception-bearing chunks.
The third pattern is grounding drift: and remain high, yet drops and contradiction rates increase; may also decline. Evidence was available, but generation behavior diverged from it. Typical interventions include stricter citation requirements in high-risk domains, explicit abstention policies for unsupported claims, prompt adjustments that penalize unsupported synthesis, and rollout gates on contradiction growth.
These patterns compress live triage. Instead of broad discussions about “model quality,” on-call teams can identify the first broken stage and assign work immediately. The remediation rule is simple: target the earliest confirmed break in the evidence path.
This doctrine also improves postmortem quality. Reports that simply state “the model hallucinated” rarely prevent recurrence. Reports that identify a precise failure chain—for example, “temporal facet removed by rewrite variant v17, causing stale retrieval candidates and downstream unsupported synthesis”—create actionable prevention tasks and ownership clarity.
5. Operationalization: dashboards, gates, and on-call practice
Instrumentation has limited value unless integrated into daily operations. A useful observability surface should let an engineer answer three questions quickly: which stage is failing, whether failure is global or segment-specific, and which rollout likely introduced it.
Dashboard design should therefore combine outcomes with stage metrics. Outcome panels track user-visible impact (task success, human ratings, verifier pass rates). Coverage panels track , , , and over time and by query class. Attribution panels track support-score distributions and contradiction trends. Retrieval/rerank panels reveal rank-shift behavior and candidate-depth recall proxies. Source-health panels capture ingestion delay, freshness drift, and document-volume anomalies. Together, these panels prevent a common anti-pattern in which user-facing quality degrades gradually while each subsystem appears locally healthy.
Alerting strategy should follow stage boundaries, not a single monolithic hallucination alarm. Sustained degradation should page retrieval/indexing. decline under stable should page ranking/context owners. decline with rising contradiction under stable and should page generation governance. Citation regressions after prompt/model rollout should trigger release guardrails. Burn-rate windows are preferred to instantaneous thresholds to reduce noise and alert fatigue.
Release governance is the second operational pillar. Model, prompt, index, and reranker rollouts should be gated not only on aggregate success metrics but also on stage-specific non-regression criteria. In regulated or high-risk domains, deployment should block if contradiction rate increases or if degrades beyond tolerance even when global averages improve. Segment-aware gates are essential because aggregate wins can conceal catastrophic losses in minority but business-critical query classes.
On-call playbooks should formalize an evidence-first triage order. First inspect ; if low, halt generation tweaks and address retrieval path integrity. If is healthy, inspect and rank-shift traces to detect selection loss. If both and are healthy, inspect , contradiction, and citation behavior for grounding drift. Then correlate with recent rollouts and verify recovery by segment, not global mean. This sequence reduces time-to-mitigation and avoids reactive changes that mask symptoms.
A practical implementation can proceed in phases. Phase one captures complete trace events with strict IDs and versioning. Phase two computes the core metrics per request and per segment. Phase three adds dashboards and alerts with owner routing. Phase four enforces rollout gates and codifies postmortem templates around first-failure-stage analysis. Most teams can reach this maturity in weeks if scope is constrained to a minimum viable observability stack.
6. Conclusion
Hallucination diagnosis in RAG systems improves dramatically when treated as evidence-path analysis rather than output-only quality scoring. Attribution traces reconstruct how claims were formed; coverage metrics identify where the path broke. Together, they transform incident response from speculative prompt tuning into structured engineering.
The framework presented here emphasizes pragmatic sufficiency: a stable trace spine, four interpretable metrics, layered attribution checks, and stage-aware operational controls. These components are lightweight enough for production adoption and strong enough to support causal triage. Their primary value is organizational as much as technical: they enforce clearer ownership, reduce remediation ambiguity, and prevent repetitive failure cycles.
As RAG deployments move from experimental prototypes to business-critical infrastructure, reliability will depend less on model novelty and more on observability discipline. Systems that can explain not only that they failed but where the evidence path failed first are the systems that improve fastest and fail least.
References
- Lewis, P. et al. “Retrieval-Augmented Generation for Knowledge-Intensive NLP Tasks.” *NeurIPS*, 2020.
- Gao, Y. et al. “Retrieval-Augmented Generation for Large Language Models: A Survey.” *arXiv preprint arXiv:2312.10997*, 2023.
- Kamoi, R. et al. “When Can LLMs Actually Correctly Answer Questions? A Study of Hallucination and Faithfulness.” *arXiv*, 2024.
- Thakur, N. et al. “BEIR: A Heterogeneous Benchmark for Zero-shot Evaluation of Information Retrieval Models.” *NeurIPS Datasets and Benchmarks*, 2021.
- Rajpurkar, P. et al. “SQuAD: 100,000+ Questions for Machine Comprehension of Text.” *EMNLP*, 2016.
- Reimers, N. and Gurevych, I. “Sentence-BERT: Sentence Embeddings using Siamese BERT-Networks.” *EMNLP-IJCNLP*, 2019.
- Williams, A. et al. “A Broad-Coverage Challenge Corpus for Sentence Understanding through Inference (MultiNLI).” *NAACL*, 2018.
- Mallen, A. et al. “When Not to Trust Language Models: Investigating Effectiveness of Parametric and Non-Parametric Memories.” *ACL*, 2023.
- Es, S. et al. “Ragas: Automated Evaluation of Retrieval Augmented Generation.” *arXiv preprint arXiv:2309.15217*, revised 2025.
- Microsoft Learn. “Retrieval-Augmented Generation (RAG) Evaluators for Generative AI.” Azure AI Foundry documentation.